The rise of China and decline of the eurozone are two themes that continue to dominate the top end of the Top 1000. But some equally significant changes are taking place further down the rankings.
The tectonic plates of global banking have been shifting noticeably ever since the financial crisis began in 2008, but The Banker’s Top 1000 World Banks ranking this year shows the change in its starkest form. For the first time ever, a Chinese bank, ICBC, sits atop the rankings. With Tier 1 capital of $160.65bn, it is not quite the largest bank ever – Bank of America still holds that title, with $163.63bn in the 2011 ranking. Losses and preference share buybacks have shrunk that figure to $155.46bn in this year’s ranking, third behind JPMorgan.
Editor's choice
Beyond that, what little movement there is among the top 25 banks is almost entirely associated with China’s growth. China Construction Bank moves up one place to fifth, while Bank of Communications becomes the fifth Chinese bank to enter the top 25, driving out Dutch ING Bank.
Seismic shifts
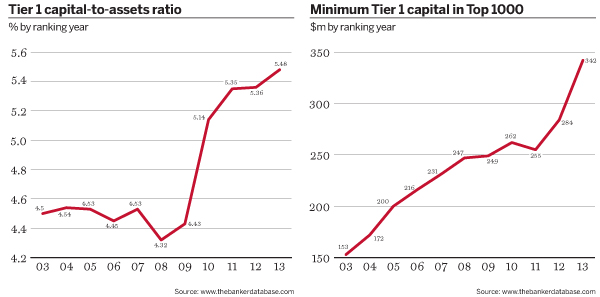
As with seismic shifts, the eruption of a Chinese bank at the top is merely the most obvious sign of much larger movement going on in the depths. The total capital for the top 25 banks has increased 10.8%, predominantly thanks to the growth of Chinese banks, and the capital-to-assets ratio continues to strengthen, to 5.16%. But compare this with the aggregate capital-to-asset ratio of 5.48% for the Top 1000 as a whole. The dramatic growth and profitability in this ranking tends to be found further down the scale. In fact, the minimum Tier 1 capital needed to enter the Top 1000, which has grown every year in the past decade except in 2011’s ranking, raced ahead this year to cross the $300m mark for the first time, reaching $342m.
This is partly a product of the ever-improving coverage delivered by our research team, but it also reflects the growth of smaller banks in emerging markets. With the exception of Tompkins Financial Corporation in the US, the banks that entered the Top 1000 thanks to organic growth are exclusively from emerging markets, especially Latin America and south-east Asia. The largest is Banco GNB Sudameris in Colombia, which purchased a number of HSBC’s operations in Latin America and enters the ranking at 888.
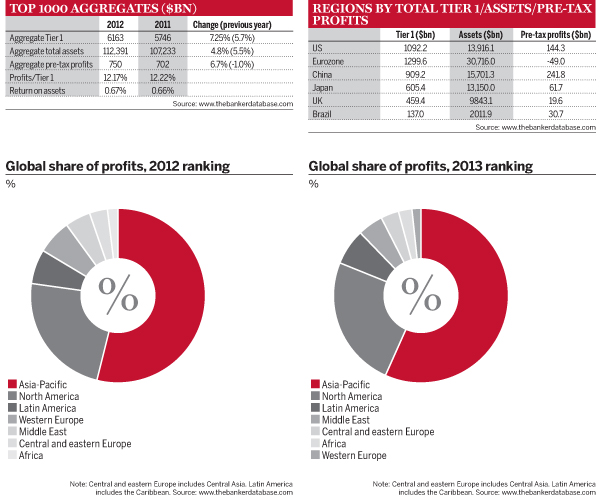
Overall, pre-tax profits for the Top 1000 in the 2013 ranking increased by 6.7%, compared with a decline of 1.0% the previous year. The rise in capital continues to outstrip profit growth, leading to the second successive year of falling profits on Tier 1, even though the return on assets was slightly improved. In reality, the profitability of emerging-market banks masked a truly disastrous performance in western Europe, which was already suffering in 2012’s ranking. While the eurozone sovereign debt crisis abated during 2012, the banking crisis continues, with an aggregate loss of $49bn for the single currency area, compared with a profit of $2.1bn last year. While UK-headquartered banks stayed in profit, this declined sharply from $32.9bn to just $19.6bn.
This means western Europe’s share of global profits is at just 1.59%, its lowest level since 2008. The share of profits in the Asia-Pacific region continues to grow, reaching 56.7% in this year’s ranking. Even more dramatic is the deleveraging in western Europe, with eurozone assets falling by almost a quarter in a single year. By contrast, assets in the major emerging markets of Brazil and China both rose about 16%, with more modest increases in the US and Japan.
Hidden gems
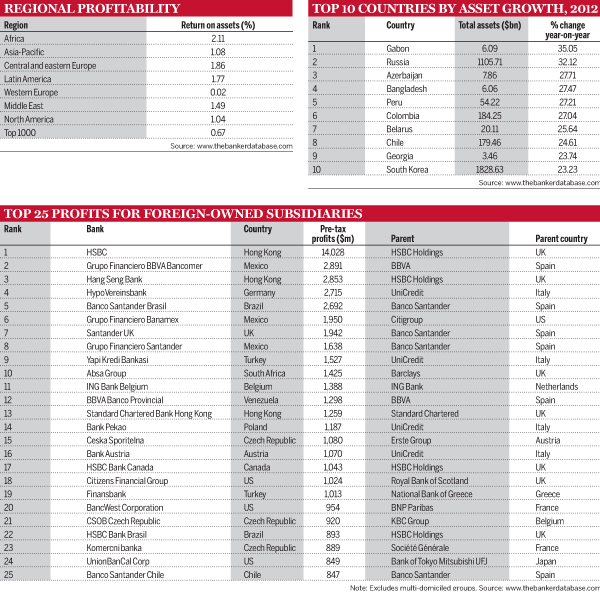
Brazil and China may loom large on investors’ radars, but they are both being outperformed by other emerging markets. In fact, Africa stands out as top performer this year. At 2.3%, it now has a higher share of global profits than western Europe, despite accounting for less than 0.8% of global assets. Pre-tax profits are up more than 30% in this year’s ranking, more than double the rise in China. Its return on assets is 2.1%, far outstripping Asia-Pacific or Latin America. China and Brazil both recorded return on assets of below 1.6%, with Brazil’s total profits actually falling in financial year 2012. Kenya is the top African market for return on assets, at more than 5%, and enjoys a new entrant in the ranking – the Cooperative Bank of Kenya entering at 1000. Elsewhere, Bangladesh is one of the fastest-growing markets, and it has a 43% return on capital. Total assets per capita are not much more than $40, making this the most underbanked country represented in the Top 1000.
This year’s ranking may also change perceptions of central and eastern Europe (CEE), widely characterised as the victim of contagion from eurozone banking groups with high market penetration in the CEE region. There are certainly troubled markets such as Slovenia and Ukraine, but the region as a whole was second only to Africa in terms of return on assets. Out of the top 10 countries for asset growth, four were from CEE, led by the largest market in the region – Russia. Even in Russia itself, the market is a divided one. A range of retail-focused banks are earning return on capital of more than 20% or even 30%, whereas many of the large corporate banks are struggling to push profit on capital into double figures and some are loss-making.
In Latin America, the Andean region is clearly outperforming Brazil, with Peru and Colombia both among the top 10 countries for asset growth. Profits in Colombia are up more than 50% in the 2013 ranking, with those in Peru rising almost 20%, and both countries enjoy a return on assets above 2.5%. Among the largest banking markets, Mexico appears to be fast taking over from Brazil as the engine of Latin American banking performance, with 32% profit growth and return on assets approaching 2%.
Foreign fields
The rise of Mexico is also reflected in the performance of its foreign-owned banks, which are proving essential sources of profit for their parents. BBVA’s Mexican subsidiary Bancomer recorded the second-largest profits of any foreign-owned subsidiary in this year’s ranking, and the Mexican banks owned by Citi and Santander both featured among the top 10.
Brazil and longstanding outperformer Turkey each contribute another two banks to the top 25 most profitable foreign subsidiaries. But once again, the CEE region delivers a positive surprise: the Czech Republic matches Mexico and Hong Kong by delivering three of the most profitable 25 subsidiaries. The smallest profit in this list in the 2013 ranking is $847m, substantially higher than the $650m threshold needed to enter the list last year.
HSBC’s presence in Hong Kong remains the largest individual profit-generator by far, but also something of a special case given the bank’s historic origins there. Its subsidiaries in Canada and Brazil are also very valuable to the group. The presence in Latin America is of enormous importance to Santander and BBVA given their troubled home market, and they have five Latin American subsidiaries between them among the top 25 largest profits for foreign-owned banks. Santander’s UK operation should not be forgotten: it was out-earned only by the bank’s Brazilian subsidiary.
Italy’s UniCredit, another bank facing fiscal austerity at home, gained from its CEE network, although its German bank HypoVereinsbank is still the most important source of profit by some distance. The group managed to record a loss in this year’s ranking, despite the boost from four of its foreign operations featured in this top 25. This reflects the fact that some of its foreign subsidiaries have been rather less helpful. ATF Bank in Kazakhstan lost money for the fourth year in a row in 2012, and in 2013 UniCredit sold the bank to a Kazakh company for about a quarter of what it originally paid back in 2007, just before the country suffered a real estate crash. Assuming no serious decline in its current Tier 1 capital, ATF will begin to appear in next year’s Top 1000 on a standalone basis.
Under new management
Merger and acquisition (M&A) activity is itself a fundamental part of reshaping the global banking map. UniCredit sold ATF to place a floor under downside risks owing to its poor performance. But other western European banks have been forced to sell relatively profitable foreign subsidiaries as part of their restructuring plans, to raise capital and meet EU competition rules after receiving state bail-outs.
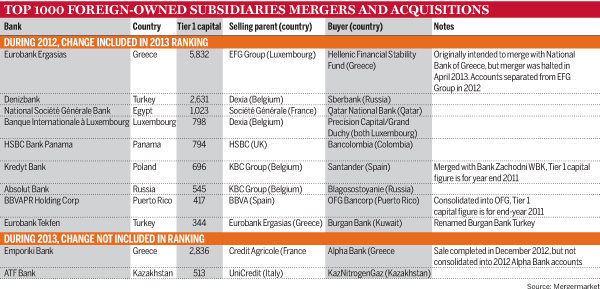
Our table on page 120 shows the foreign-owned subsidiaries that have changed hands since the start of 2012. Belgian banks Dexia and KBC between them account for four of the divestments in this table, including profitable units in the large, high performing emerging markets of Russia, Turkey and Poland. KBC has also sold a subsidiary in Serbia that is too small to feature in this ranking. Under pressure, banks will naturally sell subsidiaries that are likely to find willing buyers, and attractive Turkey accounts for two of the sales in this list.
Greece is the other story contributing a significant number of entries on this table: EFG Group lost control of its Greek subsidiary Eurobank to the government bail-out fund after a merger with National Bank of Greece was overruled by the authorities. Eurobank has also divested a subsidiary in Turkey and the future of its network in the rest of south-eastern Europe looks very uncertain. Finding buyers for subsidiaries in Bulgaria, Romania and Serbia may prove challenging, however. Austria’s Volksbank was forced to retain its Romanian subsidiary in 2011 when the rest of its network was sold to Sberbank.
France’s Credit Agricole completed the sale of its Greek unit Emporiki to local Alpha Bank in December 2012, just too late to be included in 2012 annual accounts. The deal was signed for just €1 after Credit Agricole pumped in €2.9bn of new capital. Alpha recorded €2.6bn of that amount as fresh capital for itself in the first quarter of 2013, suggesting it is more optimistic about the prospects for Emporiki. Effectively, the French bank was willing to pay up to cap any future losses in Greece. Aside from three Spanish banks, Credit Agricole recorded the largest loss in the 2013 ranking of a bank that was profitable in last year’s ranking. France’s Société Générale also disposed of its Greek subsidiary Geniki to local bank Piraeus. Geniki is too small to be included in the Top 1000.
On the acquiring side, several banks stand out, all based in emerging markets. Colombian banks are particularly active in Latin America, mopping up a series of undersized subsidiaries that HSBC has disposed of over the past 18 months. Many of these were too small to make it into the Top 1000. Qatar National Bank purchased Société Générale’s subsidiary in Egypt, and also bought locally owned Alternatif Bank in Turkey, which is too small for inclusion in the Top 1000. And Russia’s Sberbank looks set to use Turkish Denizbank, acquired from Dexia last year, to consolidate assets from other departing foreign banks – it is currently negotiating the purchase of Citi’s consumer lending business in Turkey.
You can find the bank-holding companies that have been subject to M&A in our list of banks that left the Top 1000 on page 266. This list is dominated by the forced mergers of Spanish cajas, in an attempt to build a smaller group of larger banks that can find a meaningful business model. One intriguing deal in 2013 was the sale of Hypo Alpe Adria’s domestic banking operations in Austria to an Indian investor via a Singaporean holding company for about $85m. The Austrian government, which was forced to nationalise Hypo Alpe Adria in December 2009, will now look to sell the group’s CEE network either as a whole or country by country.
Spanish shockwave
The M&A trends are a substantial reversal of the historic acquisition of banks in emerging markets by western European parents. As emerging markets are rising, the other side of the coin is the brutal decline of European banking. Western Europe as a whole recorded aggregate profits of just $11.9bn, with the eurozone losing $49bn. The vast majority of this loss is attributable to Spanish banks which lost $72.5bn altogether. But even excluding Spain, return on assets for the eurozone is a paltry 0.07%.
Non-eurozone markets are hardly faring better. In fact, the UK’s 26 bank-holding companies and foreign subsidiaries, with $10,432bn in assets, generated $20.5bn in the 2013 ranking. That leaves the UK behind France, whose nine banks with $9951bn assets produced profits of $21.2bn.
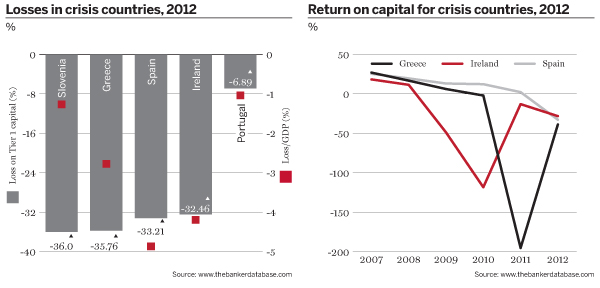
The still unfolding crises in a number of eurozone countries have taken very different trajectories, as well as having varying significance for their national economies. We flagged up Slovenia as a possible emergency room patient in 2012’s Top 1000, when its four banks in the Top 1000 suffered losses equivalent to 25% of their Tier 1 capital. The situation continued to deteriorate in 2013’s ranking, with losses reaching more than 36% of capital and two banks, Abanka Vipa and Gorenjska Banka, falling out of the Top 1000 altogether due to the shrinkage of their Tier 1 capital.
This is the worst return on capital for any country in the 2013 ranking, but the Slovenian banking sector is not large relative to the wider economy. Consequently, the losses represent only 1.27% of gross domestic product (GDP), or 1.69% if the two banks that fell out of the Top 1000 are included. Slovenia has so far avoided calling on EU bail-out funds, helped by the fact that three of its top five banks are foreign-owned. All three foreign subsidiaries managed to stay in profit in this year’s ranking – but only just.
By contrast, while Spanish losses were slightly smaller as a proportion of total capital, they represented a much larger share of GDP, with deeper implications for the Spanish government. There are many indicators that point to delayed recognition of the scale of the difficulties in Spain. In all, nine Spanish banks have reported losses in the 2013 ranking after remaining profitable in the 2012 ranking, and five of the top 10 losses for previously profitable banks were in Spain. Yet the canary in the coalmine, Caja de Ahorros y Monte de Piedad de Cordoba, first saw its capital wiped out by losses in 2009.
In Ireland, which suffered a similar real estate bubble and crash, the banking sector as a whole first recorded an aggregate loss in 2009, worsening in 2010 before staging a partial recovery in 2011. Admittedly mitigated by the continued overseas profits of Santander and BBVA, the Spanish banking sector was still reporting profits in 2011, making this ranking its first aggregate loss of the crisis. Worryingly, Irish losses actually intensified again in this year’s rankings, suggesting the Spanish cajas could be a long way from recovery.
In Greece, the focal point of the losses was the catastrophic impact of the private sector involvement under which more than 70% of the value of Greek government bonds was written off in return for an EU bail-out of the sovereign. Unlike the Spanish housing bust, Greek banks appear to have provisioned for much of this hit before it happened – in their 2011 results – with a substantial recovery in this year’s ranking. The sector remains loss-making and the economy still in recession, but the consolidation and recapitalisation process should enable the re-emergence of a smaller number of sustainable banks. Even excluding the extraordinary gain from revaluing the Emporiki acquisition, Alpha Bank returned to a profit of €244m in the first quarter of 2013.
Survival stories
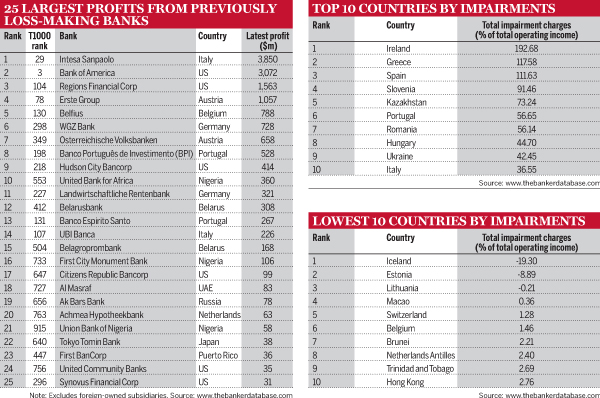
Among the crisis countries, Portugal is perhaps the most promising sign that there is life after near-death for eurozone banks, paring back losses to less than 7% of capital in the 2013 ranking. Two of Portugal’s banks, Banco Português de Investimento and Banco Espirito Santo, were among the largest 25 profits for banks that reported losses in the previous ranking. Impairment charges fell from 63% of operating income in the previous ranking to 57%. Compare this with Ireland, where impairment charges jumped from 122% to a table-topping 193% of total operating income, or Spain, where they surged from just 44% to almost 112%.
There are three countries where total impairment charges are negative – Iceland, Estonia and Lithuania. All three experienced severe banking crises, with real estate the primary cause in the case of the two Baltic states. All have undergone a comprehensive clean-up of their banking sectors, with Iceland placing its three largest banks into insolvency, creating three new banks that feature in the Top 1000 and separating non-performing assets into wind-down ‘bad banks’. With potential problematic loans recognised, the banks can begin to write back assets onto the balance sheet as they manage to recover loans or help borrowers exit default. In Iceland, this has generated return on Tier 1 capital of 17% in the 2013 ranking, with return on capital of 14% in Estonia and 11% in Lithuania.
As anticipated in the introduction to last year’s rankings, Intesa Sanpaolo’s goodwill write-downs in central and eastern Europe represented a one-off hit to its results, and in this year’s rankings the group records the largest profits of any previously loss-making bank. Austria’s Erste has been through a similar process and is also among the top 25. Another Austrian bank, Volksbank, has staged a remarkable come-back after a state bail-out and the forced sale of its CEE network to Sberbank in 2011. Bank of America appears to be shaking off the legacy of its acquisition of subprime lender Countrywide at the height of the crisis, although a deal to end litigation with investors in Countrywide’s mortgage-backed securities is still facing challenges in court. In total, five other US banks plus one from Puerto Rico feature in the top 25 profits among previously loss-making banks, showing the gradual escape from subprime. Overall, profits in the US are up almost 10% in the 2013 ranking.
The other market staging a strong comeback is Belarus, where a heavy currency devaluation in 2011 threw the banking sector into disarray. The country’s two largest banks reported combined profits of $476m in this year’s ranking, compared with losses of $785m the previous year. Other countries in the CEE region are facing rather more troubling prospects. In Ukraine, impairment charges remain constant at 42% of total operating income, while Hungary and Romania have now overtaken Ukraine in terms of poor asset quality. Impairment charges in Romania more than doubled as a proportion of total operating income. Despite the uncertainty, those foreign banks that are committed to the country are willing to act as consolidators. Raiffeisen Bank International, which controls the country’s fourth largest bank, bought Citi’s Romanian consumer finance operations in March 2013, while the country’s third-largest bank UniCredit Tiriac bought retail operations from RBS a month later.
Adapting to regulatory change
The divestment of non-core operations is all part of the deleveraging trend triggered by regulatory pressure to increase capital adequacy. Restructured European banks such as Commerzbank and RBS have shrunk their total assets by more than a quarter (or more than 30% in Commerzbank’s case) since 2009. At the same time, banks have been obliged to ramp up capital to meet the new requirements of Basel and national regulators. The Swiss supervisors have adopted the strictest approach in recognition of the size of the country’s two largest banks relative to its economy. It is no surprise to find UBS and Credit Suisse at numbers two and three in western Europe for Tier 1 capital increases since 2009, totalling 45% for UBS and 35% for Credit Suisse. However, the identity of western Europe’s fastest-growing bank by capital in the past three years is a sobering reminder that genuine growth is the best condition for raising capital and strengthening the balance sheet. Standard Chartered tops the table in western Europe not only for Tier 1 capital growth since 2009 (at 65%), but also for asset growth, average capital adequacy, average return on assets and average return on capital.
The process of deleveraging is not only about raising capital and shrinking total assets. Basel ratios are measured using risk-weighted assets (RWAs), and the process of reducing and rebalancing risks can also yield significant improvements in overall capital adequacy. In last year’s ranking, we saw the impact of the introduction of the interim capital rules known as Basel 2.5. These rules introduced the concept of stressed value-at-risk (VaR) to measure banks’ market exposures. Stressed VaR and national stress-testing had the effect of massively increasing market RWAs – more than tripling them in the case of some European banks.
This year, banks have responded by paring back their market risk exposures, which should also in theory reduce earnings volatility in the future. In some cases, banks have shut entire divisions that they consider excessively capital-intensive. Most notably, UBS began to withdraw from fixed-income trading during 2012, and the effect on their market RWAs is clear, falling by just over 30%. Only RBS, which has been on a crash diet programme ever since its government bail-out in 2008, shrank its market RWAs more sharply in 2012.
Yet the need for UBS’s efforts is clear: even after this large reduction, the bank still has a larger share of market RWAs in its total balance sheet than any other in Europe. UBS also managed the largest decline in credit RWAs in 2012, by more than 18%, followed at some distance by Lloyds and Deutsche Bank on 13% and 11%. Inevitably, there is a one-off cost to shrinking balance sheets and staff headcount, both directly in terms of loss crystallisation from asset sales and redundancy packages for staff, and indirectly in terms of opportunity cost. UBS tipped back into a loss in the 2013 ranking, recording the fifth-largest loss of any bank that was profitable in last year’s ranking. Its management will be hoping that the measures undertaken in 2012 are sufficient to return it to more stable profitability in the future.
Barclays, Deutsche Bank and Credit Suisse are the other three outliers in terms of market risk. Deutsche already reduced its market RWAs by more than 20% in this year’s ranking, while the other two were moving more slowly. In its 2015+ strategic review finalised in September 2013, Deutsche set out RWA reductions of about €60bn from asset sales and hedging, of which two-thirds were to come from non-core operations. The bank managed the second sharpest decline in total RWAs in the latest Top 1000 after UBS.
In February 2013, Barclays chief executive Antony Jenkins announced the bank’s intention to cut total RWAs in the bank’s fixed income, currencies and commodities division to £36bn from £79bn by 2015, and the bank has ceased proprietary trading in soft commodities. Credit Suisse kept a tighter rein on market RWAs in 2012’s ranking, but the pace of reduction slowed in 2013’s Top 1000 compared with Deutsche or UBS – or indeed BNP Paribas and HSBC. These two banks started from a much lower base in terms of market RWAs to total RWAs, but still managed to cut more than 20% from market risk during 2012.
Overall, despite the efforts to reduce credit and market risk, Barclays’ RWAs rose slightly in the latest ranking. But this is entirely attributable to a massive 55% surge in operational RWAs. This is no surprise, because operational risk includes litigation and regulatory enforcement, and Barclays had to make settlements totalling $453m over Libor rigging in 2012. A similar factor explains the rise at RBS. However, the banks with the largest shares of operational RWAs remain those with the largest branch networks, namely HSBC and Santander, as the risks to physical property tend to be the most important component of operational risk. After scaling back its operations on the ground in a number of countries, especially in Latin America, HSBC was able to reduce operational RWAs in 2013’s Top 1000, despite paying a $1.9bn fine to US authorities over money-laundering at its Mexican operations.
As US banks never entirely adopted Basel II, it has not been possible to build a comprehensive and comparable data set for RWAs. However, the apparent commitment of the US authorities to implementing Basel III should ultimately enable us to draw a comparison of the shape of balance sheets between the largest US and European banks.
Predicting risk
As the past few years have amply demonstrated, predicting risk in the banking sector is not a pastime for the faint hearted. But the beauty of the Top 1000 is the ability to compare banking sectors around the world. Judging what numbers pose a risk in absolute terms has proved difficult even for regulators, but outliers in relative terms are always worth keeping an eye on.
Funding and liquidity risk have prompted far greater attention since the financial crisis. Loan-to-deposit ratios are the traditional method for testing how far banks have become reliant on wholesale funding and whether they are exposed if financing conditions become unstable.
Unfortunately, loan-to-deposit data for some of the world’s largest banks is difficult to decipher. Global banking groups make extensive use of interbank markets for funding themselves and for placing excess liquidity. Clearly, interbank deposits cannot be considered in the same bracket as retail savings. The 2008 liquidity squeeze painfully demonstrated that interbank funding could disappear within hours for any bank that becomes the subject of swirling speculation about its credit quality. Yet, there is no consistency in the way that interbank deposits are broken out and reported for the largest banking groups. With the advent of Basel III, which introduces the liquidity coverage and net stable funding ratios plus tighter reporting requirements, it may well become easier to compare liquidity positions among the largest banks.
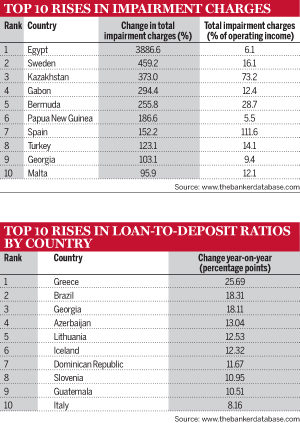
In the meantime, loan-to-deposit data is still useful to compare smaller banks with simpler balance sheets. The direction of travel for loan-to-deposit ratios can also be revealing. An increased loan-to-deposit ratio can be the product of sharp deposit outflows, and it comes as no surprise to see this phenomenon in action in some of the eurozone countries. Greece tops the list, followed closely by Slovenia and Italy. Intriguingly, Iceland also suffered deposit outflows in 2012, despite the recovery of its banking sector.
On the other side of the equation are banking sectors where loan growth is far outstripping the ability of banks to collect deposits, suggesting rising household and corporate indebtedness in the country. Brazil is the most striking example of this, with loans rising 17% while deposits stagnate. Azerbaijan’s banking sector is represented by just one bank, state-owned International Bank of Azerbaijan (IBA), although this national champion controls almost 50% of the country’s banking assets. IBA received a 40% capital increase from the government in 2012 to repair the damage of losses suffered in 2010, giving it some headroom for the 27% rise in loans, of which only about half was funded by increased deposits. However, IBA still has a capital adequacy ratio well below that of any other bank in Azerbaijan’s early-stage and volatile financial sector.
Another good directional indicator is the evolution of impairment charges, with sharp rises likely to warn of deteriorating asset quality. A combination of rising impairment charges and high asset growth could be particularly indicative of a credit boom characterised by falling underwriting standards – Gabon falls into this category based on this year’s ranking.
Total impairment charges in Egypt have soared since the disruption of the Arab Spring uprisings, but they still remain very low by international standards as a proportion of total operating income. This perhaps reflects the low level of bank intermediation in the Egyptian economy. More troubling is the surge in impairment charges in Sweden. The country previously had the lowest impairment charges as a proportion of total operating income in the EU, but this ratio has now jumped not only well above Scandinavian peers Finland and Norway, but also above core eurozone states France and Germany. There had long been complaints from other EU countries that Swedish banks were assigning exceptionally low risk-weights to their mortgage lending books.
The deterioration in Kazakhstan is mostly due to a sharp rise in impairment charges at Kazkommertsbank, the country’s largest bank by assets. It quadrupled its impairment charges in 2012, but management explained that asset quality was largely unchanged – the bank was instead responding to regulatory changes that required increased provisioning. Still, asset quality in the country remains challenging. Halyk Bank, the country’s largest by Tier 1 capital and profits, has reported non-performing loans consistently between 16% and 18% for four consecutive years. Efforts to create a national bad bank to purchase the large number of distressed real estate and construction loans in the Kazakh banking sector have so far faltered over tax and legal difficulties.
One country appears in the top 10 for asset growth, the rise in loan-to-deposit ratios and the increase in impairment charges in the 2013 ranking. That combination of indicators should give pause for thought about the trajectory of the banking sector in Georgia. The offsetting factor for the country’s largest bank, Bank of Georgia, is a 40% capital increase in 2012 thanks to a secondary share offering, which gives the bank a substantial cushion against any risks building up from a possible credit bubble.
The Banker has long remarked that there is one other useful risk indicator in the Top 1000 – the willingness of banks to disclose their data for publication. The list of banks that departed the Top 1000 this year due to late submission of data is worth consulting on page 266. Of course, The Banker’s tireless research team will continue its efforts to ensure the best possible coverage of banks in this ranking.
The research for The Banker’s Top 1000 rankings was carried out by Adrian Buchanan, Guillaume Hingel, Charles Piggott, Valeriya Yakutovich, Alberto Berardi and Marcus Ward.


