There’s nothing quite like a period of economic disruption to test the banking system’s stamina, and with economies on both sides of the Atlantic reeling in the wake of the Covid-19 pandemic, North America and Europe’s largest institutions are certainly being put through their paces.
Our analysis has compared the performance of the 23 global systemically important banks (G-SIBs) that are based in the US, Canada and Europe during the first half of 2020, looking at metrics such as asset quality, liquidity and operational efficiency to determine which G-SIBs are in the best health.
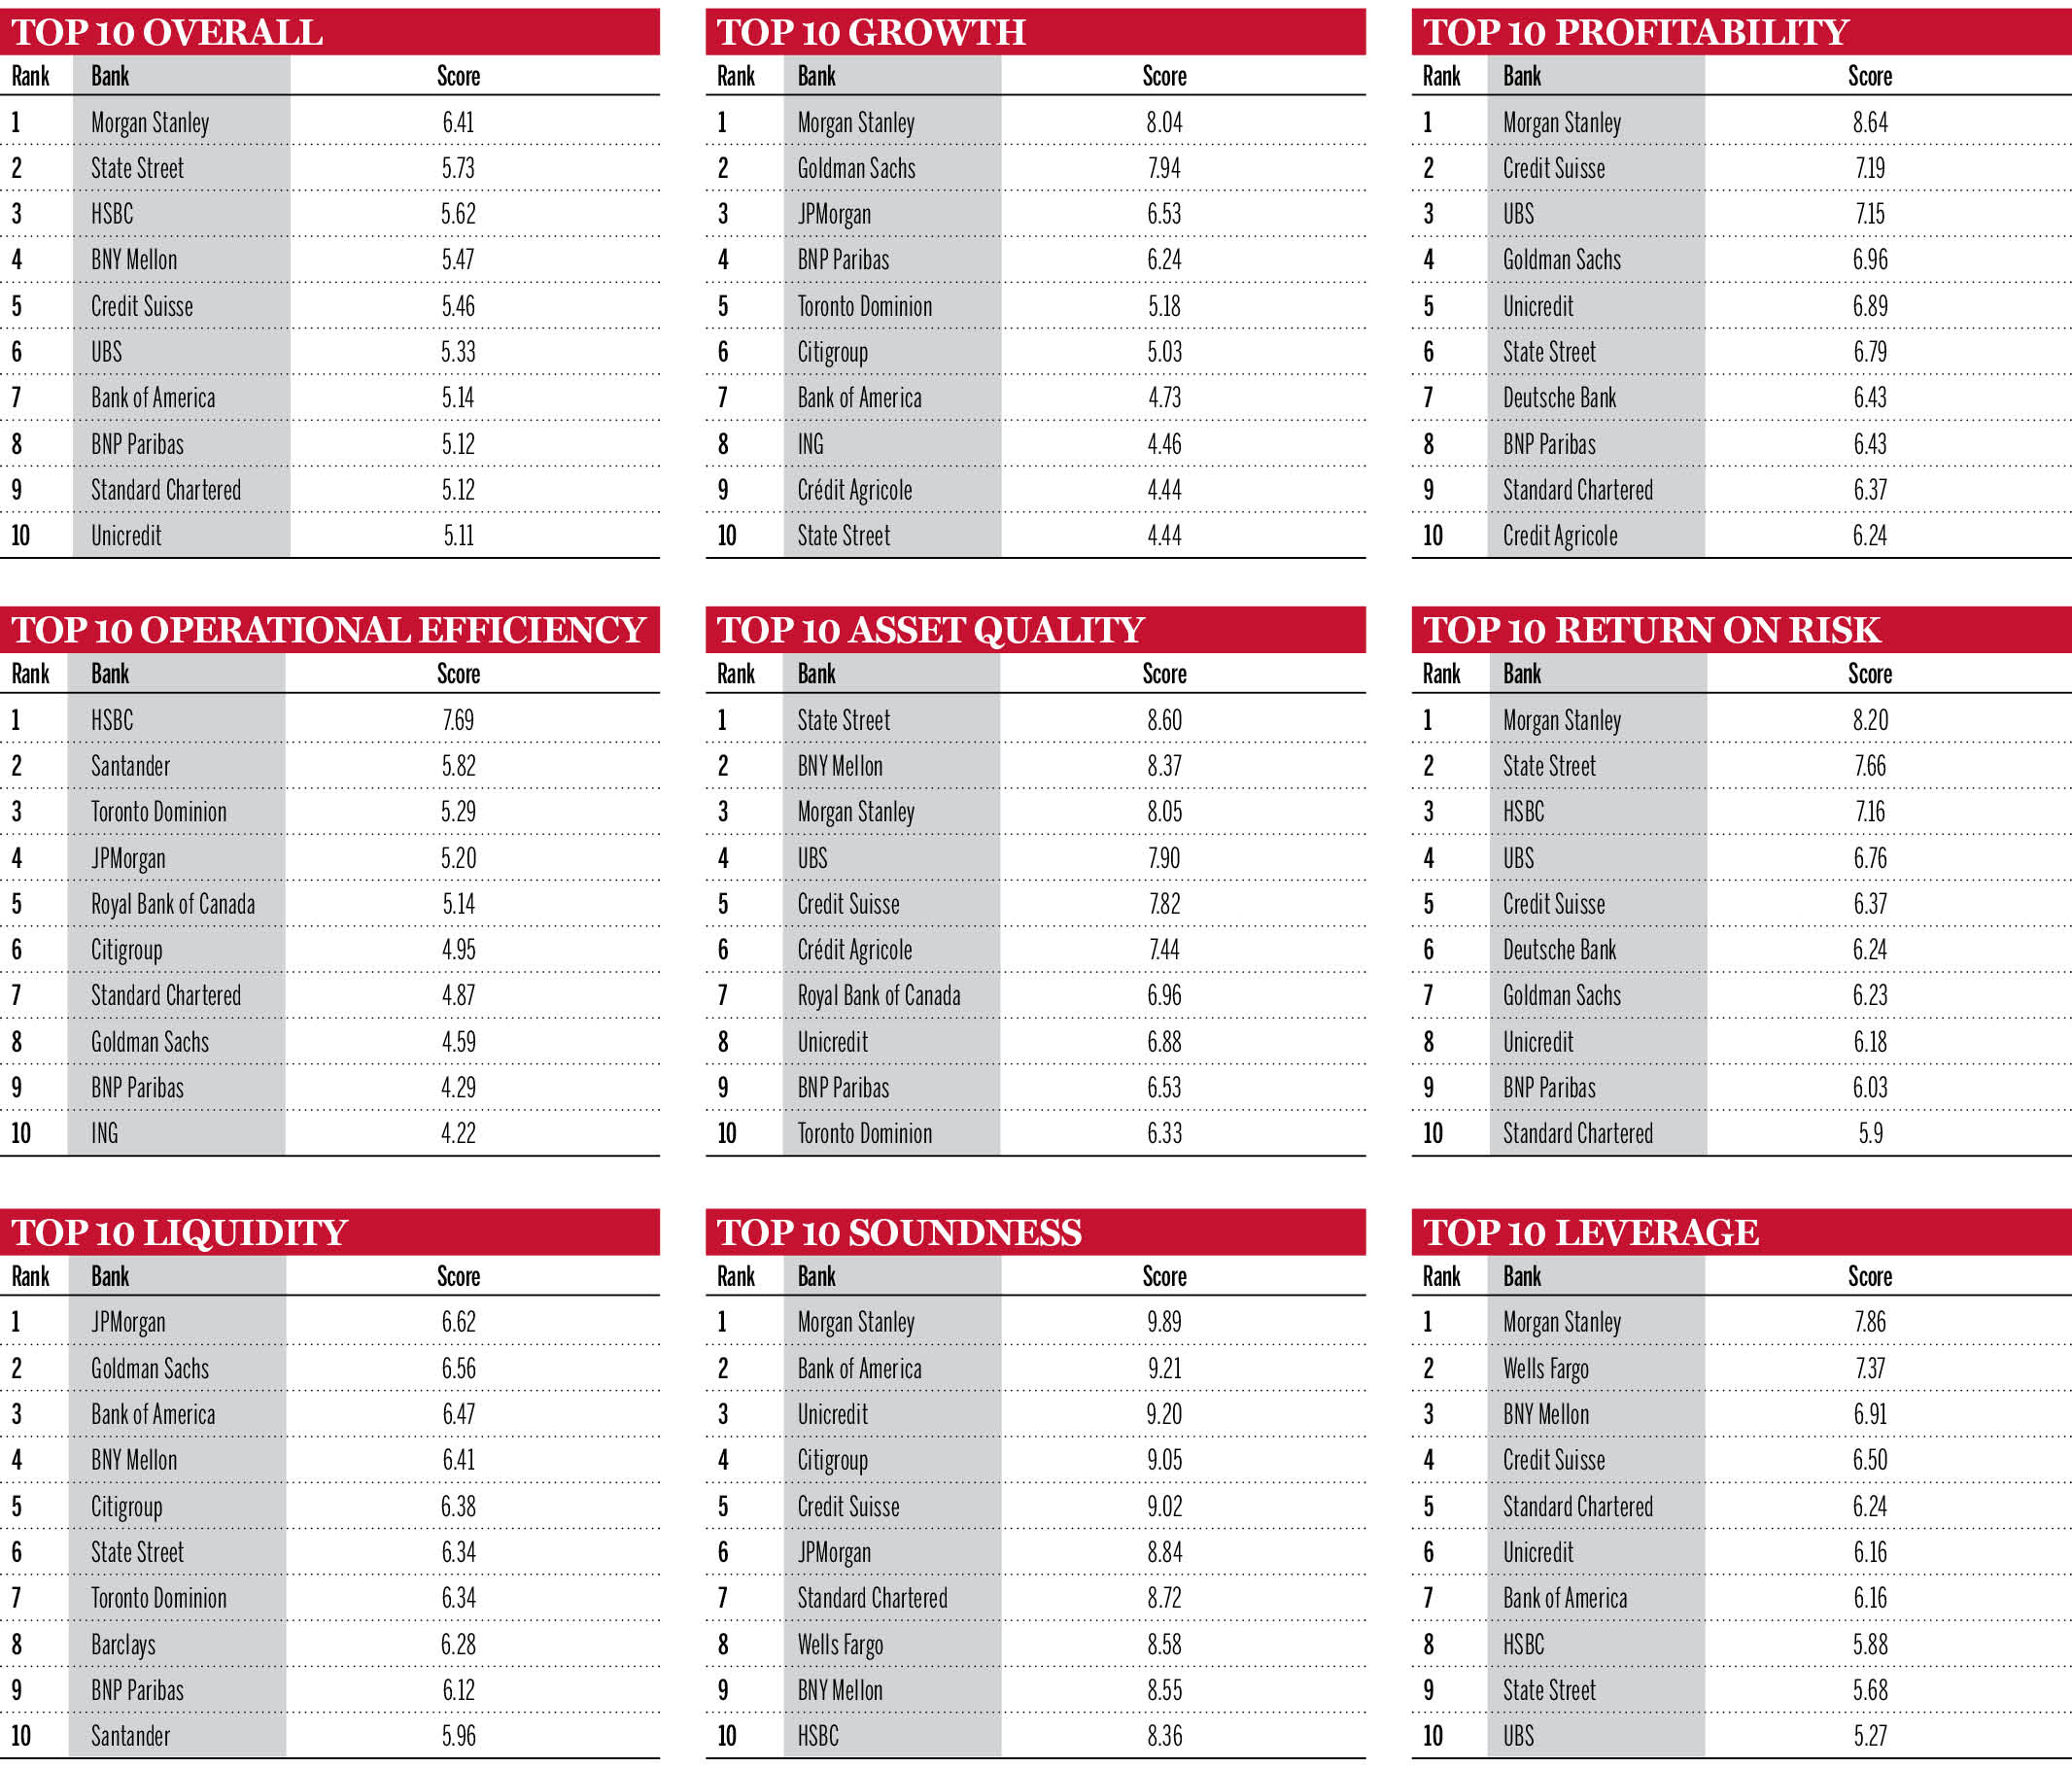
And while two US banks, Morgan Stanley and State Street, may have claimed the highest two positions in our overall performance table – which combines eight indicators of banks’ strength and profitability to come up with an overall score and ranking – it’s far from a clean sweep by North American banks in the top 10 slots. Six European banks made the top 10 for overall performance, compared to four North American banks.
A key theme in financial results for the first two quarters of 2020 has been the importance of revenue from capital markets businesses in offsetting some of the hit that banks have taken in credit provisions. Christian Scarafia, co-head of western European bank ratings at Fitch, says: “When you look at the capital markets revenue, results in the first half have really shown that it can provide a diversification [that] is quite beneficial at this time.”
He adds: “Having said that, after years of retrenching and refocusing, European banks that are still active in capital markets cover less of a spectrum of product areas than their large US competitors.”
Against this backdrop, one might expect that North American banks – several of which have substantial and broad capital markets businesses – to have been more dominant in our tables than is the case.
Bottom of the rankings
Société Générale and Wells Fargo both struggled in our overall performance rankings, coming in 23rd and 22nd position, respectively. It has been a difficult first half for Société Générale, particularly its equities division, where its equity derivatives business was hit hard by European corporates cancelling dividends during the first quarter. The bank has announced a revamp of the division in order to cut costs and reduce its risk profile.
For Wells Fargo, its smaller investment banking and capital markets business relative to US peers with comparably sized balance sheets, such as Citi, means it has borne the brunt of provisions for souring loans without being able to offset that against capital markets revenue. It also remains constrained by the asset cap imposed on it by regulators in the wake of the ‘fake accounts’ scandal (although the cap has been modified to allow the bank to increase its lending to businesses during the coronavirus pandemic).
Christopher Wolfe, managing director, North American banks at Fitch Ratings, says: “[Wells Fargo has] all the credit risk, for which they’re taking provisions, but they’re not getting the benefit that Citi, JPMorgan and Bank of America were getting on the capital markets front. I think there are also longer-term issues that have been brewing for a while, such as the overhang from the mis-selling issues that has yet to really go away.
“They’re also still subject to an asset cap from regulators, which doesn’t allow them to take advantage of opportunities that they probably would have otherwise. And I think they have a high cost structure, which they really need to address; I think they’ve acknowledged that, but that’s something which will take a couple of years.”
An asset quality question
One of the main reasons that Morgan Stanley and State Street appear to have topped the table relates to their relatively small loan books, and the loans that they do have on their balance sheet are concentrated to corporate and financial institution clients. For Morgan Stanley, 27.1% of its total assets are loans, whereas for State Street this is just 9.6%. As a result, the amount of provisions that these two banks have needed to make is lower than for their peers with more substantial loan books, and both (so far) have been able to maintain a level of profitability similar to that seen in 2019.
When looking at asset quality – an indicator measured by looking at the combination of allowance for loan losses on total loans ratio, non-performing loans ratio and the impairment charges to total operating income ratio, as well as by the changes to those values compared with the previous year – State Street is highest ranked and Morgan Stanley is third. Total impairment charges and provisions at the 10 North American G-SIBs increased by 437% year-on-year, when first-half 2020 figures are compared with 2019, to reach $65.5bn. Morgan Stanley represented just $239m of that total, while State Street has set aside $52m in provisions.
North America’s three largest banks by assets, JPMorgan, Citi and Bank of America, were also the three that set aside the most in provisions at $10.5bn, $8bn and $5.1bn respectively, coming in 22nd, 23rd and 16th place, respectively, for asset quality in our rankings.
The first and second quarters of 2020 were the first quarters where US banks have had to adhere to the Financial Accounting Standards Board mandated Current Expected Credit Losses accounting standard, which came into effect in December 2019, in their reporting. This is a significant development, as it means that banks must effectively front-load the cost of expected losses that may occur at any time during the life of the loan in their accounting. Stuart Plesser, senior director, banks at S&P Global Ratings, says: “I think the provision levels are 25% to 30% higher than they otherwise would have been under the previous accounting regime.”
US banks make up just three out of the top 10 G-SIBs for profitability in our table, measured by looking at return on assets, return on equity, profit margin and asset utilisation ratios. However, it is interesting to note that at an aggregate level, there is not a drastic difference in pre-tax profits drops at North American versus European G-SIBs. Pre-tax profits fell at European G-SIBs by 52.1% year-on-year, compared to the first half of 2019, while falling by 57.9% at North American G-SiBs for the same period. Impairment charges as a percentage of operating income have increased from 6.62% at an aggregate level for European banks at the end of the first half to 18.5%; for North American banks, this has changed from 4.6% to 23.7%.
Given the very high levels of uncertainty about the progression of the coronavirus and the trajectory of economic recovery, significant question marks remain over asset quality at both North American and European banks.
In particular, some analysts have noted the relatively wide variation in the levels of provisions that European banks have reported. Giles Edwards, senior director, banks at S&P Global Ratings and sector lead for Europe, the Middle East and Africa, says: “There is a big unknown in terms of asset quality. By the second quarter we would have expected the provisions being taken to be a bit more comparable between banks but that hasn’t happened. And it is quite hard to get underneath those figures to understand who is being cautious and prudent, versus those who may be underestimating. The proof will come at the end of the year.”
Laurie Mayers, associate managing director, banking at Moody’s, says: “Our view is that for US banks, they have already taken more than half of what they will ultimately need to in provisions. For the Europeans as well, we’d say they’ve probably taken at least 75% of what we think they’re going need to take for the full year.”
Sound capital base?
One of the significant differences between recent months and the financial crisis is the level of confidence that the world’s ‘too big to fail’ banks are well capitalised and able to ride out these turbulent times relatively smoothly. Keen to ensure capital levels remain healthy, regulators have also acted quickly – leading to banks across Europe freezing (or heavily reducing, in the case of Swiss banks) dividend payments, while in the US dividends have been capped and share buyback programmes cancelled.
Mr Wolfe says: “I think banks are more quickly recognising that they have to be more diligent with their capital, and some of that is regulatory-driven. Dividends in Europe have been curtailed and share buybacks, which are the largest component of capital distributions for US banks, have been on hold. When you compare with the global financial crisis, it took a while for banks to even cut dividends or share buybacks. This time it was almost immediate.”
The Canadian G-SIBs, Royal Bank of Canada and Toronto Dominion, are the only banks in our sample not impacted by such measures, with Canadian banks not facing any restrictions on dividend payments outside of standard capital adequacy and liquidity rules.
Ms Mayers says: “If we look back to the global financial crisis, the regulatory measures that were put into place have resulted in, from both the capital and liquidity point of view, this peer group being in a totally different place than they were back then. Banks have also formalised processes around the management of risk, capital and liquidity. So they should have a much better idea of what could happen and the steps they need to take now, so that they don't breach their risk appetite or their capital targets.”
This being said, there were variations in how banks performed as measured by our soundness indicator (based on a bank’s capital to assets ratio and annual change). Morgan Stanley, Bank of America and UniCredit topped the table for this measure.
Efficiency edge
US banks have a reputation for operational efficiency when compared to some of their international peers, however HSBC topped the table for this metric, which looks at cost-to-income ratio and its annual change. It was followed by Santander and Toronto Dominion.
HSBC, which is currently embarking on a significant programme of cost cutting, may seem an odd frontrunner for this metric, but the result reflects some early success the bank appears to have had in bringing down its costs. Last year, its cost-to-income ratio stood at 123% compared to 63% this year. Santander and Toronto Dominion have the second and third lowest cost-to-income ratios out of the 23 banks in our sample.
It has been well documented that consumer savings rates have increased in recent months in many parts of Europe and North America, particularly in the weeks and months immediately after lockdown measures were imposed. The US Bureau of Economic Analysis found that American consumers saved 33% of their disposable income in April – a historic high. Data from the European Central Bank and the Bank of England suggest consumer savings drastically increased in France, Italy, the UK and Spain around the same time. Deposit levels at banks have risen significantly: gross total deposits at North American G-SIBs increased by 20% in the first half of 2020 compared to 2019, and in Europe by 12%.
Over the same period, gross total loans also increased, although by a smaller margin: 3.4% for North American G-SIBs and 5.7% for European G-SIBs. However, this has not been uniform across banks as shown by performance against our growth indicator – which looks at annual growth in assets, loans, deposits and operating income. Here Morgan Stanley again topped the table, followed by Goldman Sachs and JPMorgan. All three banks saw significant increases in their operating income, and Morgan Stanley also saw the biggest percentage increase in its gross total loans year-on-year, at 52.9%.
JPMorgan and Goldman Sachs were both also top performers in our liquidity table, a measurement combining loans-to-assets ratio and loans-to-deposits ratio, as well as annual changes. However, in this area Morgan Stanley performed poorly, ranking last out of all the banks in our sample. It was the only G-SIB to see its loans-to-assets ratio increase year-on-year, and one of only three banks to see its loans-to-deposits ratio increase.
Methodology
Our “best-performing banks” model scores and ranks banks in eight key performance categories, using 17 ratios, and assigns an overall best-performing bank score and ranking.
The model can be used to identify the best performers in any sample group, be it an existing global, regional or country ranking or a custom peer group such as global systemically important banks.
The model only uses performance ratios, and year-on-year percentages and basis points changes, so the size of a bank has no influence on its best bank ranking position.
The performance categories and indicators are:
Growth – Annual percentage growth in assets, loans, deposits and operating income.
Profitability – Return on assets, return on equity, profit margin, asset utilisation (and annual basis points [bps] change in these ratios).
Operational efficiency – Cost-to-income ratio (and annual bps change in these ratios).
Asset quality – Allowance for loan losses to gross total loans, non-performing loans, impairment charges to total operating income (and annual bps change in these ratios).
Return on risk – Return on risk-weighted assets (and annual bps change in this ratio).
Liquidity – Loans-to-assets ratio, loans-to-deposits ratio (and annual bps change in these ratios).
Soundness – Capital assets ratio (and annual bps change in this ratio).
Leverage – Total liabilities to total assets (and annual bps change in this ratio).


